Insights A Closer Look: What Will Drive Lower Interest Rates?
Date: 10/3/2025
Authors

Jerry H. Tempelman, CFA
Vice President, Economic and Fixed Income Research
At its September monetary policy meeting, the U.S. Federal Reserve resumed the easing cycle to lower short-term interest rates that it began last year. How much further will the Fed lower rates? The answer depends on a couple of key factors:
- the Fed’s assessment of the balance of risks it faces in achieving its dual mandate of price stability and maximum sustainable employment, and
- the level of what economists refer to as the neutral rate of interest, which is the interest rate level at which monetary policy is neither accommodative nor restrictive.
Restrictive vs. Accommodative Policy
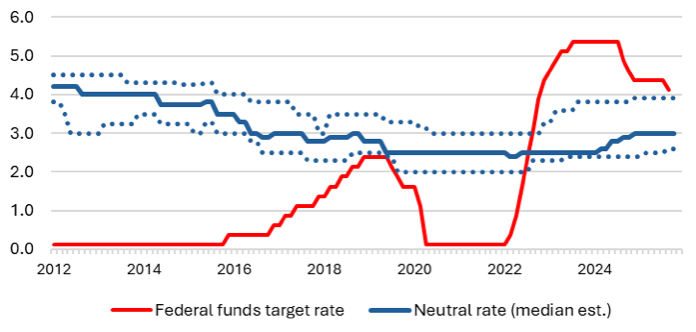
Since 2022, the Fed has deemed inflation a greater risk than unemployment. Thus, monetary policy has been restrictive. As the chart below highlights, the Fed’s target level for the federal funds rate—the rate at which banks lend to each other that is a benchmark for other interest rates—has been above the neutral interest rate. Prior to 2022, the Fed was more concerned about unemployment. Thus, monetary policy was more accommodative, as the Fed left the federal funds target rate below the neutral rate.
Federal Funds Target Rate v. Neutral Interest Rate (%)
After the September Federal Open Market Committee (FOMC) meeting, Fed chairman Jerome Powell pointed to what he called a “shift in the balance of risks” to explain why the Fed had lowered the federal funds target rate. Relatively weak job growth in recent months has prompted Fed officials to renew their focus on the maximum sustainable employment part of the Fed’s dual mandate.
The Neutral Rate of Interest
As the Fed has lowered its target for the federal funds rate, beginning in 2024, monetary policy has become less restrictive. How restrictive the Fed’s policy still is depends on the level of the neutral rate of interest. No one knows that level. It is something that economists must estimate. The estimate of the Fed officials on the committee that votes on monetary policy is proxied by their long-run projections for the federal funds rate in the Fed’s quarterly Summary of Economic Projections. The solid blue line in the chart is the Fed’s median estimate of the neutral rate at any given quarter. The uncertainty of the level means that there is a range of estimates by the Fed’s committee members—the dotted blue lines in the chart reflect the minimum and maximum estimates of the committee members at any given quarter.
Economists’ estimates of the neutral rate of interest change over time, as shown in the chart. In 2012, Fed officials’ median estimate of the neutral rate was above 4 percent. By the early 2020s, that had drifted down to approximately 2.5 percent. The decline is part of a longer downward trend that economists have long recognized. Principal causes for this include a decrease in the growth rate of the working-age population, both in the United States and in other Western nations, and an increase in structural saving rates. In the wake of the global financial crisis, a general increase in risk aversion, and a preference for holding relatively safe assets such as short-term Treasury bills, may also have played a role.
More recently, however, economists have begun to revise their estimates of the neutral rate of interest upward again, as seen in the chart. In spite of abrupt and severe tightening of monetary policy by the Fed in 2022–23, the U.S. economy did not experience a recession. It would appear that monetary policy may have been less restrictive than economists thought during that time. This could explain why inflation—although down from the postpandemic highs of 2021–22—remains well above the Fed’s target level today.
Reasons for Neutral Rate Increase
In spite of relatively high nominal interest rates in recent years, if it turns out that monetary policy has been less restrictive than the Fed intended, it could be that the neutral rate of interest has moved higher again than generally recognized. There may be various reasons for the increase in the neutral rate. These include higher U.S. government budget deficits, productivity gains from improvements in global supply chains following the pandemic, investments in artificial intelligence, and greater investor preference for risky assets during the past two years. If people increase their spending following gains in the financial markets, the natural rate will also increase. Another reason is that retiring baby boomers are in the process of monetizing their assets to fund their retirement. All these factors may be offset by a decline in net immigration and the impact of tariff revenues on the U.S. federal budget deficit.
Outlook
As noted earlier, the collective impact of all these factors is uncertain. As the chart shows, the Fed’s current target level for the federal funds rate, at just above 4 percent, is only slightly higher than Fed officials’ highest estimate for the neutral rate of interest. Indeed, Powell called the Fed’s current policy stance only “modestly restrictive” in a recent speech. By contrast, Fed governor Stephen Miran, whose estimate of the neutral rate is below his colleagues’ average, recently characterized the Fed’s current stance as “well into restrictive territory.”
How much further the Fed will lower short-term interest rates depends in part on how much more the balance of risks will shift, in the Fed’s view. But it will also depend on the future path of the level of the neutral rate of interest.
Jerry H. Tempelman is Vice President of Fixed Income Research at Mutual of America Capital Management LLC where he is a credit analyst of financial institutions (banks, insurance companies, real estate investment trusts) with the Company. Previously, he was a credit strategist with Moody’s Analytics, and a Senior Financial and Economic Analyst with the Federal Reserve Bank of New York.
The views expressed in this article are subject to change at any time based on market and other conditions and should not be construed as a recommendation. This article contains forward-looking statements, which speak only as of the date they were made and involve risks and uncertainties that could cause actual results to differ materially from those expressed herein. Readers are cautioned not to rely on our forward-looking statements.
The information has been provided as a general market commentary only and does not constitute legal, tax, accounting, other professional counsel or investment advice, is not predictive of future performance, and should not be construed as an offer to sell or a solicitation to buy any security or make an offer where otherwise unlawful. The information has been provided without taking into account the investment objective, financial situation or needs of any particular person. Mutual of America is not responsible for any subsequent investment advice given based on the information supplied.
Mutual of America Capital Management LLC is an indirect, wholly owned subsidiary of Mutual of America Life Insurance Company. Insurance products are issued by Mutual of America Life Insurance Company, 320 Park Avenue, New York, NY 10022-6839. Mutual of America Securities LLC, Member FINRA/SIPC distributes securities products. Mutual of America Retirement Services LLC provides administrative and recordkeeping services. Mutual of America Financial Group is the trade name for the companies of Mutual of America Life Insurance Company.